In the previous article I explained the concept of a hierarchical management control and reporting system based on the principle of time-scale separation (i.e. separating hourly, daily, and weekly decision-making). However, this is only one dimension of hierarchical management. In this article, I introduce task decomposition, and the concept of 3-2-1 reporting, which is how decentralized decisions in a large, integrated facility are coordinated to ensure the overall operation achieves its objectives.

Decomposition
When faced with the problem of managing a complex operation, common sense tells us to apply the principle of controlling the whole by controlling the parts. In other words, decompose the big unmanageable problem into smaller sub-problems and delegate responsibility for each sub-problem to a dedicated person or team that has the capacity and expertise to do it. This is standard practice in industry, and the basis of hierarchical organizations in which spans of control are aligned with each manager's capabilities.
While the benefits of decomposition are clear, the downsides are evident. People often complain about organizational 'silos', poor communication, and lack of coordination between functional groups. The problem with decomposition is that each sub-group looses sight of the 'bigger picture' and how their actions impact other parts of the organization (so-called silo thinking).
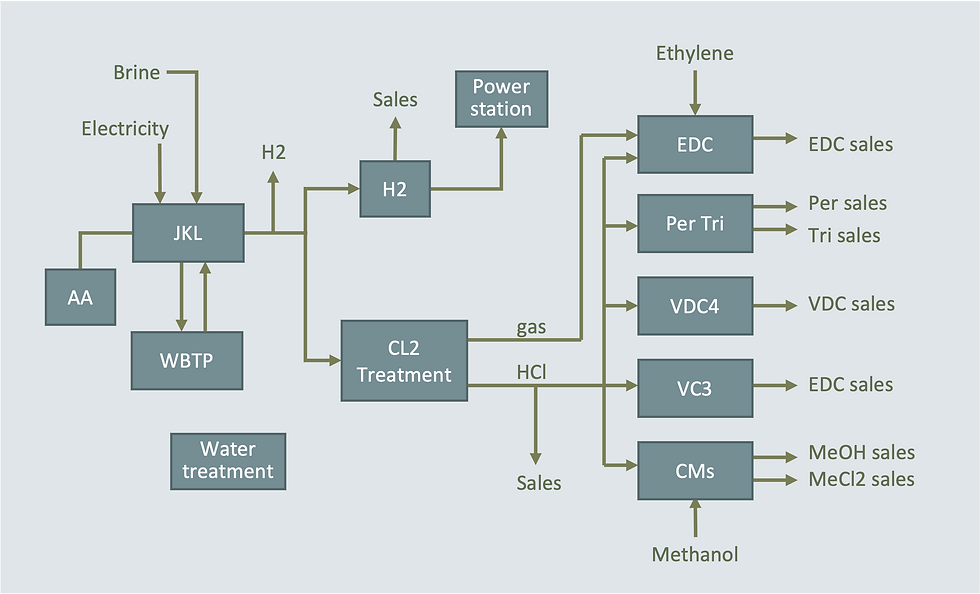
As a motivating example, consider a chemical manufacturing site where numerous production plants producing different products are connected via networks of material and energy flows (sometimes called a production complex). The diagram in Figure 1 is an example of such a network. Raw materials (in this case, brine and electricity) are converted into base chemicals (chlorine and HCl), which are then further processed in combination with other feedstocks to produce various final products. In addition, there are utilities such as power generation and effluent treatment which are shared services.
The key issue is that one manager cannot directly supervise the operation of so many assets. At the same time, each individual plant cannot be operated independently because they are dependent on each other and impact each other. Therefore, an integrated planning and decision-making system is needed.
The actual management reporting structure for this site is shown in Figure 2 below. This is an example of multi-level task decomposition. The ten production plants and two utilities were grouped into five 'sections', each with a manager. Each plant manager reports to one section manager, who reports to the site manager. While this particular structure is not the only way to organize this site, the key point is that the task of managing all the assets has been broken up into a manageable number of sub-tasks (sections), each of which consists of a manageable set of smaller tasks (plants).

The grouping of plants into sections will depend on many different factors, such as critical material or energy flows that require close co-operation, pooled resources or other shared attributes, or simply by geograpical proximity. You can debate whether one organizational structure is better than another, and there has been no shortage of attempts to change organizational structure in the hope of improving performance. However, I would argue that no structure is perfect and it is better to concentrate on exploiting the advantages of a given structure and actively mitigating the potential weaknesses. This is where a 3-2-1 reporting system comes in.
3-2-1 reporting
The goal of a 3-2-1 reporting system is to ensure that appropriate key performance indicators (KPIs) are reported and reviewed at each level of the hierarchy in a way that is aligned with the spans of control of the decision-makers, and aggregated in a way that managers at each level can identify and address coordination problems in a timely manner, so that the operation as a whole is optimized and achieves the business objectives. Figure 3 illustrates the concept.

In this diagram, the management hierarchy has three layers or levels. This is the most common structure as it aligns nicely with the three main control frequencies, hourly, daily, and weekly.
The lowest level represents processes or production areas, where performance is controlled using hourly short interval control and is reported daily or every shift to the layer above, which is the plant level. The performance of each plant is reviewed daily and reported to a weekly meeting at the top level, which is the site or general management level.
Within each area of responsibility, a small set of KPIs are chosen to report performance. These are organized in a hierarchy known as a KPI tree, as illustrated by the orange squares. At the top of each tree is a single KPI (ideally) such as production or throughput compared to plan, that captures overall performance in the area. The KPIs in the lower levels of each tree are metrics that determine or impact overall performance. Thus, each manager has a clear measure of performance in their area as well as a number of factors to explain it.
The need for coordination
In an ideal world, each production area would have full control over the processes within their span of control (i.e. complete autonomy). If this were the case, each manager could be held solely accountable for performance in their area. In practice, this is rarely the case since most processes are interconnected. As described in the example above, production in each area is dependent on upstream and downstream processes as well as other inputs and outputs such as bi-product transfers, energy supply, and utilities that are beyond the span of control of any single manager.
These dependencies and potential impacts must be identified, understood, and made visible. One way to do this is to include them in the KPI trees. For example, if Area 3 provides a key feedstock to Area 4, then the supply of that feedstock should be a top KPI of Area 3 and a contributing indicator for performance in Area 4. The manager of Area 4 is ultimately accountable for Area 4 performance, but it is clear from the KPI tree, that the manager of Area 3 has the responsibility to supply the feedstock according to the production plan so that Area 4 can meet its targets.
Every critical inter-dependency should be captured in this way so that the responsibilities are clear and the appropriate group of decision-makers reviews it at an appropriate frequency. As soon as any dependency becomes an issue, the KPIs should flag it so that an appropriate decision can be made and corrective action taken.
The performance of each plant is dependent on the performance of the process areas within it. This is reflected in the plant KPI tree, which links the performance of each process area to the overal plant performance. Daily plant production is reviewed at a daily meeting chaired by the plant manager with the process area supervisors present (see the daily-weekly operating report described in the previous article). This is where coordination problems between the process areas can be resolved. If the problem cannot be fully resolved, the production plan for the next day and possibly for the rest of the week may need to be modified.
Likewise, coordination between plants is reviewed and managed at the top (site) level. This typically happens in a weekly operations management meeting (see the weekly-monthly operating report in the previous article) where all plant managers as well as the general manager are present. Again, the key dependencies between plants should be clearly defined and visible in this meeting, along with the responsibilities for their performance.
Production planning and scheduling
You may be wondering why I hardly mentioned production planning and scheduling in this article. As most people know, planning and scheduling, or sales and operations planning (S&OP) as it is generally known, is the primary means of coordinating and optimizing production in large, integrated operations. However, it is a big and technically-advanced topic. Implementing effective S&OP processes and systems is inherently challenging for various reasons (which I plan to cover in future articles), and few companies can honestly claim to have mastered it. In contrast, 3-2-1 reporting is a simple concept that can be implemented without specialized knowledge or tools.
Furthermore, in my view, effective 3-2-1 reporting is a foundation on which to build effective production planning and scheduling. Firstly, it defines the accountabilities for operational performance. This puts managers in the driving seat when it comes to resolving planning and scheduling problems—they become the customers who demand that the S&OP process works. Secondly, it provides the evidence from the actual operation (i.e. facts and historic data) which are critical to the design of the planning and scheduling process and to the development of operational performance models, as I will explain in the next article.
Summary
Task decomposition – control the whole by controlling the parts
Silo thinking and the need for coordination
Defining critical dependencies using KPI trees
3-2-1 reporting hierarchy to control and aggregate performance.